6 Time normalization
In this analysis we want to compare the shape of the trajectories and not necessarily their duration differences. To that end, we also need to normalize the duration of the trajectories to see how they progress in time. We achieve this by expressing the time as a percentage of the trajectory duration as
We can visualize these changes:
p <- ggplot(
  f0_df,
  aes(
    x = time_norm, y = F0_st,
    color = repetition, linetype = repetition,
    group = token
  )) +
  geom_line(alpha = 0.7, linewidth = 0.5) +
  facet_grid(
    rows = vars(Speaker), cols = vars(Tone),
    as.table = TRUE, switch = "y") +
  labs(
    title = NULL,
    x = "Duration/%",
    y = "F0/semitones re. speaker median"
  ) +
  scale_y_continuous(n.breaks = 3) +
  guides(color = guide_legend(position = "bottom")) +
  theme_minimal(base_size = 18) +
  theme(
    axis.text.x = element_text(angle = 90, hjust = 1)
  )
p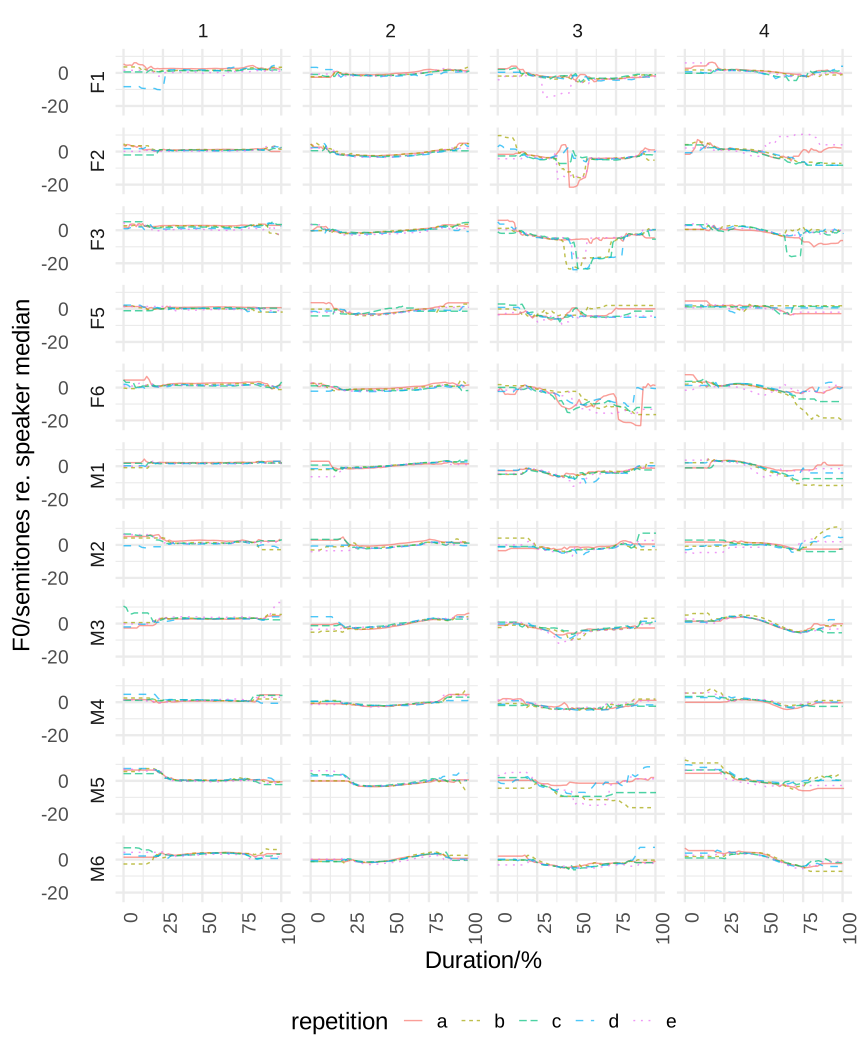
With the trajectories normalized in time and frequency, we can focus on their analysis. In this case, we want to know whether there are differences between the f0 trajectories by tone (this is expected), and whether female and male speakers differ on the shape of their tones. To that end, we would like to control for the random effect of speakers and repetitions.